sliceplots.util module
Utility functions module.
-
sliceplots.util.addcolorbar(*, ax, mappable, label=None, stub=False, **kwargs)[source]¶ Add a colorbar to a matplotlib image.
- Parameters
ax (
Axes, list of Axes, optional) – Parent axes from which space for a new colorbar axes will be stolen. If a list of axes is given they will all be resized to make room for the colorbar axes.mappable (
ScalarMappable) – TheImage,ContourSet, etc. described by this colorbar.label (str, optional) – Colorbar axis label (defaults to
None).stub (bool, optional) – If
True, return the Axes into which the colorbar was drawn. The colorbar is invisible in this case. Defaults toFalse.kwargs (dict, optional) –
Keyword arguments that control the look of the colorbar. Optional keyword arguments include:
Property
Description
pos
position wrt parent axes: left, right, bottom or top
size
5%; width, in percentage of the original axes width
orientation
vertical or horizontal
pad
0.05 if vertical, 0.15 if horizontal; fraction of original axes between colorbar and new image axes
max_ticks
maximum number of tick marks on the colorbar
- Returns
cax – New axes instance, with drawn colorbar.
- Return type
Axes
Examples
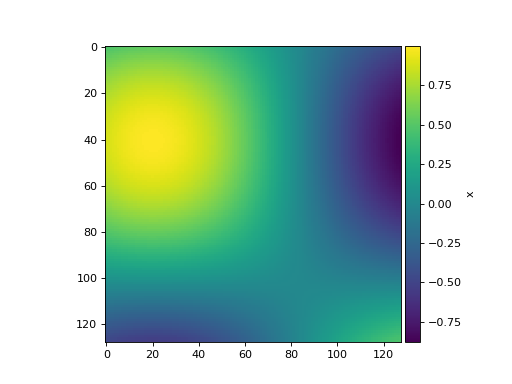
import numpy as np
from matplotlib import pyplot

from sliceplots import addcolorbar

uu = np.linspace(0, np.pi, 128)
data = np.cos(uu - 0.5) * np.cos(uu.reshape(-1, 1) - 1.0)

fig, ax = pyplot.subplots()
img = ax.imshow(data)

addcolorbar(ax=ax, mappable=img, label="x")
(Source code, png, hires.png, pdf)
