sliceplots.two_dimensional module
Module containing useful 2D plotting abstractions on top of matplotlib.
-
class
sliceplots.two_dimensional.Plot2D(*, fig: Optional[matplotlib.figure.Figure] = None, arr2d: numpy.ndarray, h_axis: numpy.ndarray, v_axis: numpy.ndarray, xlabel: Optional[str] = None, ylabel: Optional[str] = None, zlabel: Optional[str] = None, **kwargs: Optional[Any])[source]¶ Bases:
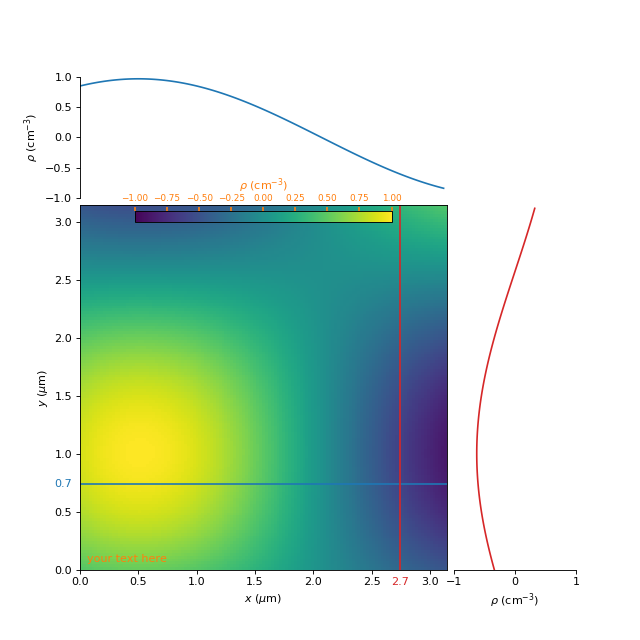
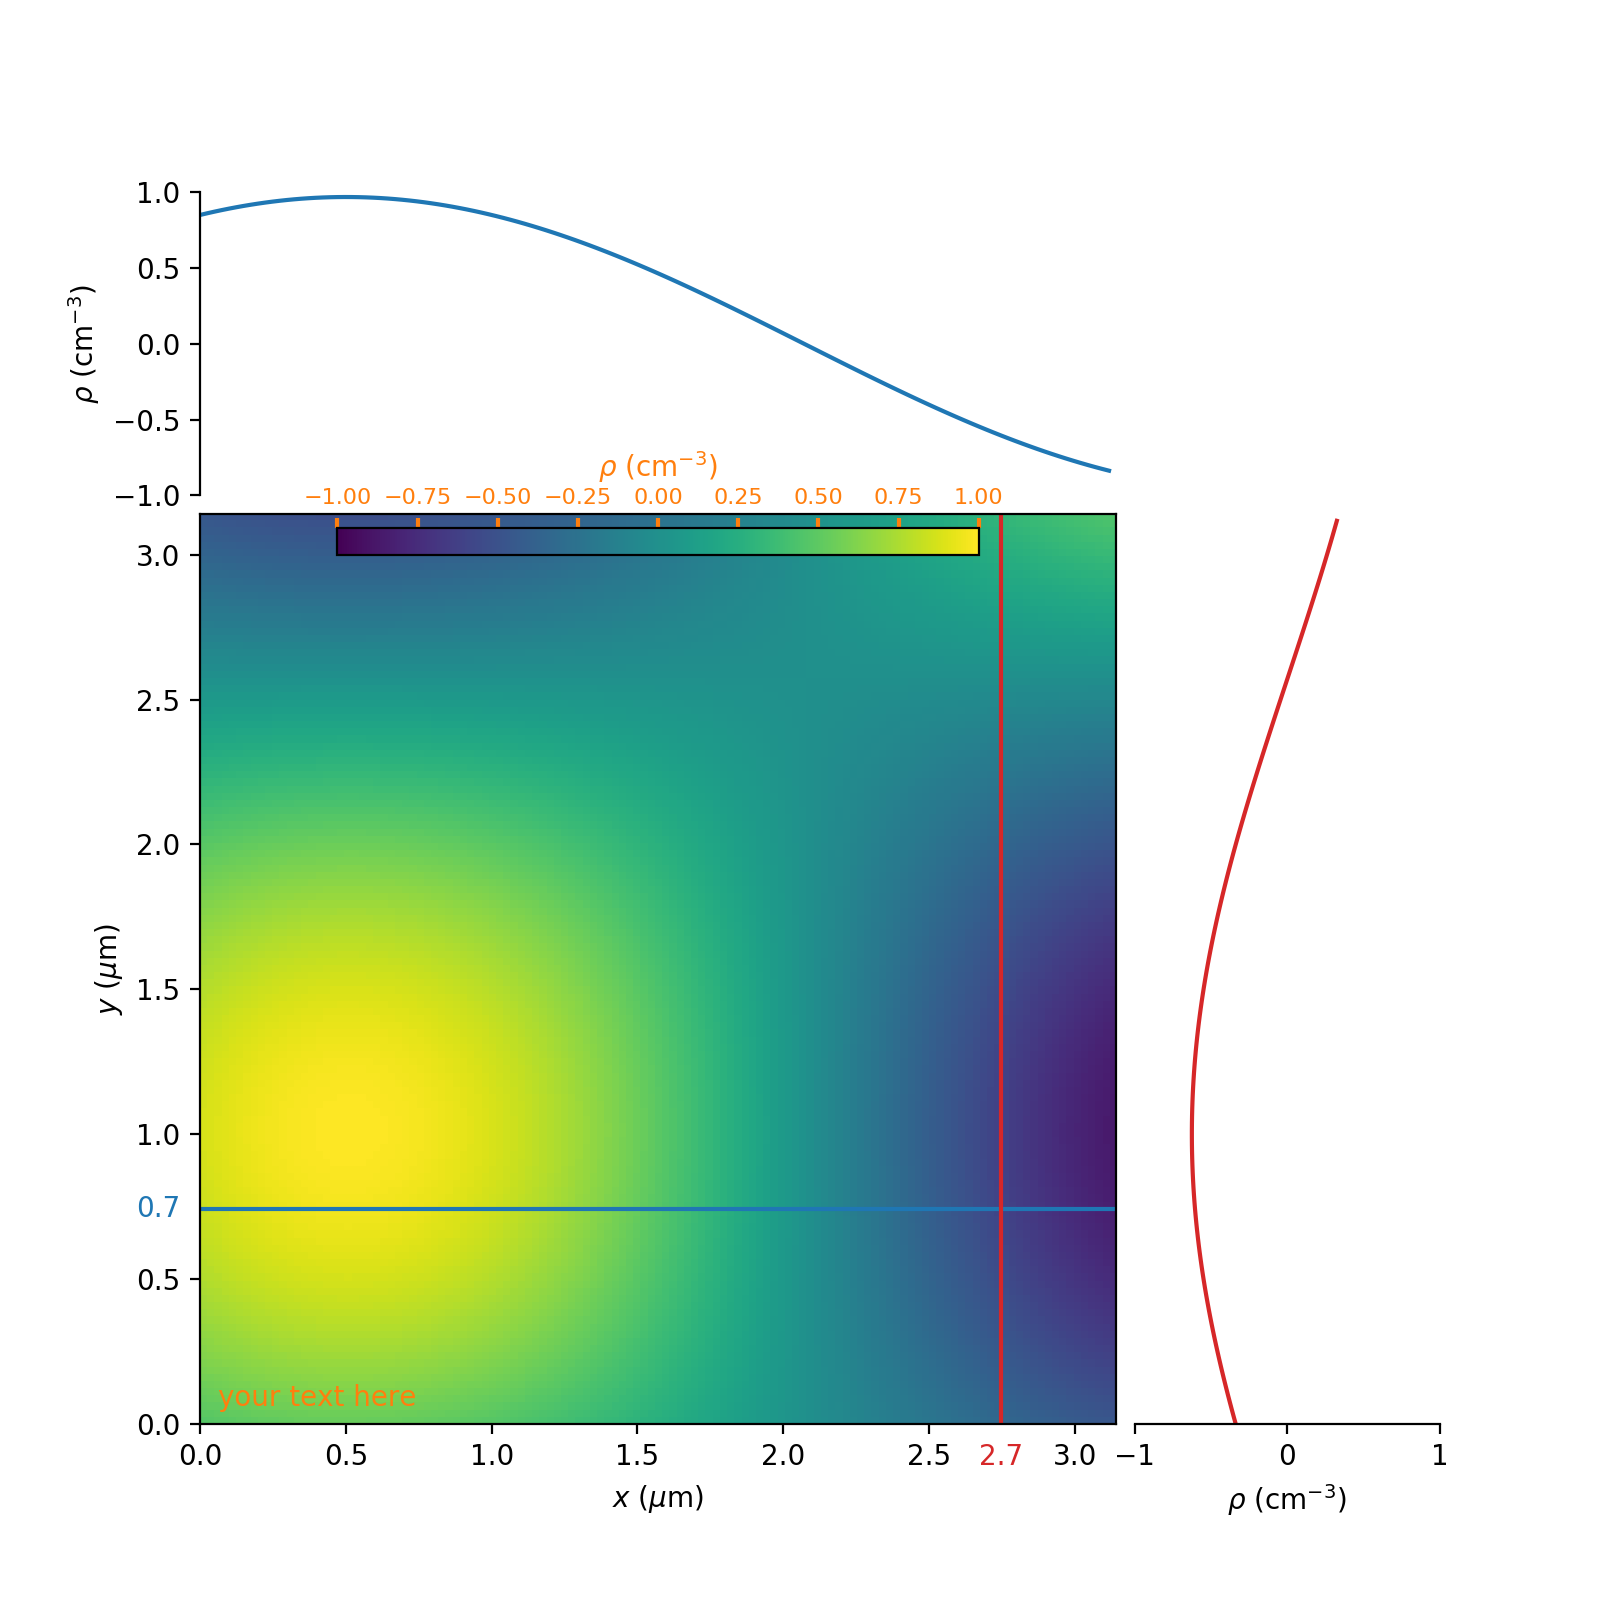
objectPseudo-color plot of a 2D array with optional 1D slices attached.
- Parameters:
fig (
Figure, optional) – Empty figure to draw on. IfNone, a newFigurewill be created. Defaults toNone.arr2d (
np.ndarray) – Data to be plotted.h_axis (
np.ndarray) – Values on the “x” axis.v_axis (
np.ndarray) – Values on the “y” axis.xlabel (str, optional) – x-axis label.
ylabel (str, optional) – y-axis label.
zlabel (str, optional) – Label for
Colorbar.kwargs (dict, optional) – Other plot options, see examples below.
Examples
import numpy as np
from matplotlib import pyplot

from sliceplots import Plot2D

uu = np.linspace(0, np.pi, 128)
data = np.cos(uu - 0.5) * np.cos(uu.reshape(-1, 1) - 1.0)

fig = pyplot.figure(figsize=(8,8))

Plot2D(
    fig=fig,
    arr2d=data,
    h_axis=uu,
    v_axis=uu,
    xlabel=r"$x$ ($\mu$m)",
    ylabel=r"$y$ ($\mu$m)",
    zlabel=r"$\rho$ (cm${}^{-3}$)",
    hslice_val=0.75,
    vslice_val=2.75,
    hslice_opts={"color": "#1f77b4", "lw": 1.5, "ls": "-"},
    vslice_opts={"color": "#d62728", "ls": "-"},
    cmap="viridis",
    cbar=True,
    extent=(0, np.pi, 0, np.pi),
    vmin=-1.0,
    vmax=1.0,
    text="your text here",
)
(Source code, png, hires.png, pdf)
